Sample Oscillographs
These samples were created digitally using a video capture device to record waveform patterns of a local AM broadcast station with typically clean and distortion free audio. These examples were captured during the speech of a male announcer with excellent voice characteristics.
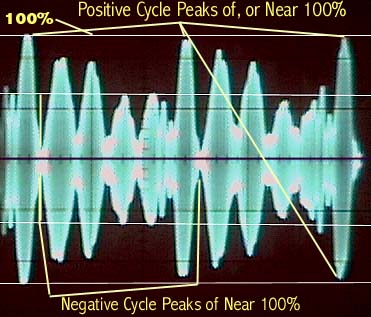
The following example points out the relationship of amplitude with the the silent carrier "bar", which is indicated by the inner two horizontal WHITE lines, above and below the center. When the audio is silent, all that's left is the carrier which would appear as a thick BAR across the scope pattern, the width of the top and bottom (inner) white lines.
The two outer horizontal white lines are imaginary lines representing where the point of 100% modulation would occur. The position of these lines is entirely dependent on the position of the two inner lines or RF carrier indicators. As you will notice, this station has three well defined positive peaks at, or near 100%, almost touching the top and bottom outer lines. In between, there are peaks of varying amplitude from zero percent to 70 and 80%.
Also notice the negative cycle peaks indicated by "valleys" in the waveform. Some of these negative peaks reach almost to the very center or "baseline" of the pattern. These are peaks which are approaching near 100% modulation on the negative cycle of the sine wave, and these negative cycles are just as important as the positive cycles. However, overmodulating (greater than 100%) the negative cycle will cause a momentary break in the waveform, thus creating severe distortion, without adding to the "loudness" or presence of the audio. You will notice this station's audio is carefully monitored and limited on positive and negative peaks, just touching the 100% level on both cycles. Also notice the smooth peak tips, no flattening, which would also produce a distorted sound by the "clipping effect" of the peaks.
An Oscilloscope setup to show information as in these two examples, has two axis's, The Y axis which is vertical, and indicates amplitude. The horizontal X axis from left to right depicts time or duration. The portion of a waveform on the left side of the CRT occurred before the portion on the right, but as in these cases, only a very short time before!
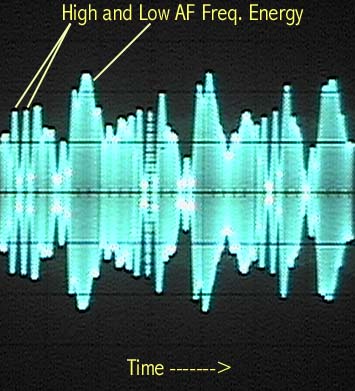
Since frequency is directly related to time, the frequency of a given AF or RF waveform can be determined by an oscilloscope. As you can easily see below, some of the sine waves within the pattern appear wider than others. This is because the human voice produces many audible frequencies at nearly one given instant. Some sine waves may be embedded within wider (lower freq.) ones, and are often difficult to see on a scope.
The example below shows a good response on both low frequency energy and high frequency energy. Someone who has used a scope for years, and is accustomed to watching voice patterns can tell at a glance if audio is well defined in both lows, midrange, and highs. It is easy to see in this example that there appears to be near equal amounts of the low end and high end, with less in between. It is normal to reduce the low midrange in the area of 240 to around 600 cps to obtain a more "full bodied" sound. The typical human voice produces much energy in this area, which can hide the lows and highs in analog production.
Copyright 1997,98,99 - W5AMI Web/SSSinc.
Last revised: April 06, 2001